

2016年歐洲資產融資調查報告——歐洲租賃市場的表現
Leaseurope provides the best gauge of performance across the European leasing and automotive rental industry. The breadth of its influence as a platform can be seen in the fact that it has member associations in 33 countries, which include affiliates in Morocco and Tunisia.
歐洲租賃協會為歐洲租賃和汽車租賃業做了最佳的測評。從歐洲租賃協會影響的廣度來看,他的會員遍布33個國家,其中包括來自摩洛哥和突尼斯的企業的子公司。
Leaseurope claims to represent some 1,400 leasing businesses and 500 short-term rental companies employing around 40,000 people, representing more than 90% of the European leasing market.
歐洲租賃協會代表1,400家租賃企業和500家短期租賃公司,40,000為雇員,這些數據能夠代表90%以上的歐洲租賃市場。
Leaseurope Index
歐洲租賃指數
An important gauge of leasing performance in Europe is the quarterly Leaseurope Index. This tracks the performance of a group of major European lessors across seven key indicators, covering total portfolio and new business volumes (NBV) along with financial ratios concerning profitability, cost/income, cost of risk, return on assets (RoA) and return on equity (RoE).
每季度的歐洲租賃指數是說明租賃市場情況的重要指標。該指數通過7個關鍵指標追蹤一大批歐洲主要租賃公司的經營狀況,其中包括總投資組合、新增業務量(NBV)和包括成本收入比、風險成本、資產收益(RoA)和凈資產收益(RoE)在內的財務比率。
Categories of assets leased include all types of machinery & equipment, cars and light commercial vehicles, trucks and heavy commercial vehicles, and real estate.
租賃資產類別包括所有類型的機械和設備、汽車、輕型商務車、卡車。重型商務車和房地產。
The Index for Q4 2015 shows an encouraging trend across all the performance indicators, with improvements in all quarters of 2015 compared to the same quarter the previous year.
2015年第四季度指數所有指標都顯示出令人鼓舞的趨勢,2015年各季度都比去年同季度有所提高。
Aggregate data, 2015
2015年數據表
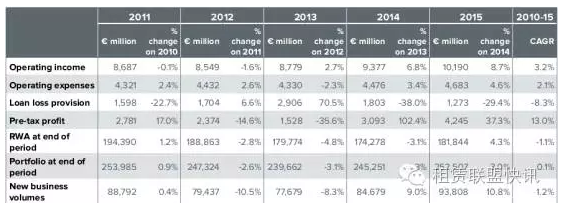
Looking at the data on an annual basis, all the indicators improved compared with 2014, indicating a much more positive trend overall for the industry after some lacklustre years. (It should be noted that the comparisons between 2013 and 2014 in the table below contain exceptional outliers regarding pre-tax profit and loan loss provision, due to a large loss provision in an isolated part of the sample in Q3 2013.)
年度數據顯示,2015年所有指標與2014年相比都有提高,這表明,在多年低迷之后,行業整體趨勢向好。(應該注意到,下表2013年與2014年的比較中,稅前利潤和風險準備金存在例外,因為2013年第三季度樣本中大額風險準備金被獨立出來)。
The compound annual growth rate (CAGR) gives average year-on-year growth rates and helps even out any unusual figures in specific periods. This measure shows progress generally in the right direction in all areas from 2010 to 2015.
復合年增長率(CAGR)給出了平均同比增長率,甚至幫助找出特定時期的任何異常的數據。這一方法顯示2010年至2015年各領域的進展。
Operating income in 2015 amounted to €10.2 billion, an impressive increase of 8.7% on 2014. The five-year CAGR for operating income is also a satisfactory 3.2%.
2015年營業收入總計102億歐元,較2014年上漲8.7%。5年營業收入CAGR為3.2%,同樣可喜。
As mentioned, the large increases in aggregate profit figures for Q4 2015 and the full year 2015 are due mainly to loan loss provisions decreasing substantially from previously high levels, leading to further cheering CAGR totals of a 13% increase in pre-tax profit and an 8.3% fall in loan loss provision.
正如前面提到的,由于風險準備金大幅降低,2015年第四季度及2015全年總利潤增長幅度大,導致稅前利潤CAGR進一步提高13%,風險準備金CAGR下降8.3%。
Meanwhile, NBV surged nearly 11% in 2015 to just under €94 billion which, despite following another strong uplift of 9% year-on-year in 2014, gives a five-year CAGR of only 1.2%. However, as elsewhere the trend is definitely upward and progress such as this is not so bad considering the economic ups and downs experienced globally and across Europe.
同時,2015年NBV飆升近11%,不到940億歐元。盡管2014年同比上漲9%,漲幅也較大,但5年CAGR僅為1.2%。然而,和其他地方一樣都是上漲趨勢,但是考慮到全球和歐洲經濟形勢波動,取得這樣的結果也并不糟糕。
Annual aggregate data, 2011-15
年度總數據,2011-15
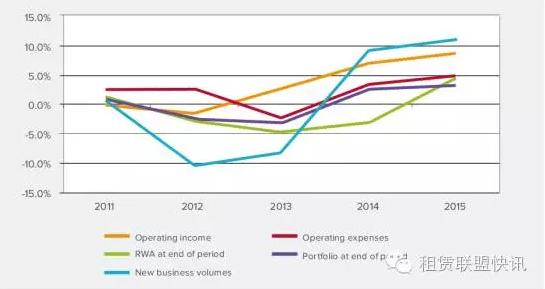
The positive trend over time is revealed by the year-on-year growth rates in the following chart (excluding the extreme fluctuations in loan loss provision and pre-tax profit), headed by the steady rise in operating income and the more recent surge in NBV.
下圖以營業收入和NBV(除了風險準備金和稅前利潤的極端波動)為首的同比增長率或是穩步增長或是大幅增長,顯示了這段時間積極發展趨勢。
Annual aggregate, change on previous year
年度總趨勢 ,相比于上一年
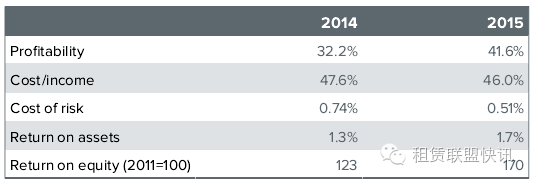
The weighted average ratios for 2013 are distorted by the extreme outlier values already mentioned, but a comparison between 2014 and 2015 ratios shows some significant improvements.
前面提到,2013年平均加權比率受異常數據影響而失真,但是2014年和2015年比率的比較顯示巨大進步。
The profitability ratio rose from 32% to nearer 42%, aided by the substantial reduction in aggregate loan loss provisions from previously high levels. This meant the average cost of risk declined from 0.7% in 2014 to 0.5% in 2015.
受風險準備金大幅降低的影響,盈利能力比率從32%上升至近42%。這意味著風險成本從2014年的0.7%降至2015年的0.5%。
There were strong improvements in the yearly RoA and RoE ratios, jumping from 1.3% to 1.7% and from 123 to 170, respectively.
年度RoA和RoE比率有明顯提高,分別從1.3%躍至1.7%,從123增至170。
These positive growth trajectories indicate that conditions for lessors in 2015 were undoubtedly favourable compared with still hesitant economic growth, demonstrating the leasing industry’s resilient business model.
這種積極的發展軌跡表明,2015年租賃公司經營狀況無疑好于目前起伏的經濟增長,這表明租賃業是具有彈性的商業模式。
Weighted average ratios, 2015 vs 2014
平均加權比率,2015&2014
Good start to 2016
2016良好開局
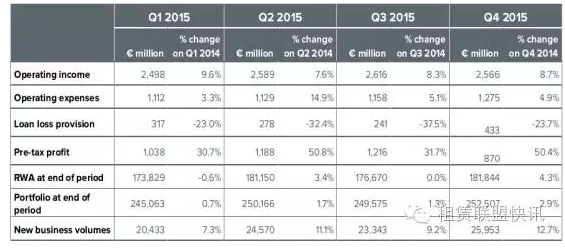
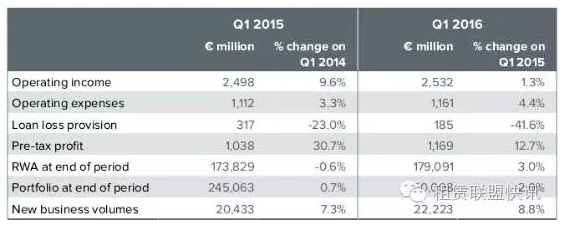
The figures revealed in the Leaseurope Index for Q1 2016 are that key indicators remain strong.
歐洲租賃指標顯示2016年第一季度關鍵指標仍然強勁。
NBV increased by 8.8% and total pre-tax profit of the participating companies saw double-digit growth of 12.7% compared with the same quarter a year earlier.
NBV同比上漲8.8%,參與調查公司的總稅前利潤呈兩位數增長,較去年同期上漲12.7%。
The portfolio of outstanding contracts grew by 2.0% and risk-weighted assets increased by 3.0%.
未完成合同上漲2.0%,風險加權資產上漲3.0%.
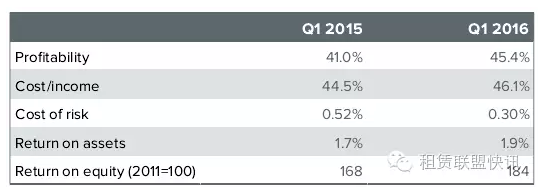
Strong profitability and declining loan loss provisions contributed to the continuation of the positive trend in RoA and RoE indicators, at respectively 1.9% and 184.
強勢的盈利能力和下降的風險準備金有利于RoA和RoE指數呈現持續的積極發展趨勢,分別為1.9%和184。
However, operating income exhibited much slower growth in Q1 2016 compared to that seen in 2014 and 2015, while operating expenses increased at a greater rate. This makes the cost/income ratio the exception amongst otherwise improving weighted average ratios.
然而,2016年第一季度營業收入較2014年和2015年,增長緩慢,但是營業支出上漲比率較大。這影響了成本收入比率和異常數據,從而使平均加權比率上升。
The Leaseurope view is that the prospect of income growth slowing whilst costs escalate could be a cause for concern in the near future, although strong new business growth, as well as increasing portfolio levels, suggests that the leasing industry is well placed to meet any challenges that the rest of the year may bring.
歐洲租賃聯盟認為,盡管新增業務量增長勢頭強勁,投資組合水平提高,但近期收益增長緩慢成本逐步攀升仍會引起警覺。這表明租賃業準備好了迎接今年剩下時間可能存在的任何挑戰。
Aggregate data, Q1 changes
綜合數據,第一季度變化
Comparison of Q1 weighted average ratios
第一季度平均加權比率比較
The industry view of prospects for 2016
2016年行業前景
The results of the latest half-yearly European Business Confidence Survey, conducted in December 2015 by Leaseurope and specialist international equipment leasing and asset finance consultancy Invigors EMEA, highlight an overall optimistic start to 2016 for European leasing.
歐洲商業信心調查是在2015年12月由歐洲租賃行業協會和國際設備租賃和資產融資咨詢公司—Invigors EMEA共同進行的。調查結果顯示2016年歐洲租賃業開局整體向好。
Providing forecasts for H1 2016, respondents expect growth to continue in a strong vein, and the balance of opinion on many other key indicators is generally favourable. These include:
調查對象預測2016年上半年增長前景存在持續強勁的跡象,對于其他關鍵指標的意見業非常積極。如下:
Nearly 45% of respondents are more optimistic about the prospects for their business during this period, while only 11% think their business prospects will worsen.
近45%的受訪者對于2016年上半年業務前景持積極態度,而僅有11%的受訪者認為業務前景堪憂。
85% of those surveyed expect new business volumes to increase, while just 5% anticipate a decline.
85%的受訪者認為新增業務量會上升,5%的受訪者認為下降。
65% of respondents anticipate that net profit in their organizations will increase over the period, with 18% forecasting a decline.
65%的受訪者認為其公司凈利潤2016年上半年將增加,18%的受訪者認為會下降。
However, 51% expect margins will decrease in their organizations, an increase on the previous survey, though a further 36% anticipate no change.
然而,51%的受訪者認為其公司的利潤會下降,而在之前的調查中他們認為利潤會上升。36%的受訪者認為利潤不會變化。
One interesting trend is that over 50% of those surveyed now think that competition from new entrants is more likely in their home market, a perception that has increased steadily over recent surveys. Expectations of merger and acquisition activity remain at the level seen in the previous survey, with 41% of respondents predicting an increase in H1 2016 compared to 56% who anticipate no change.
還有一個有趣的趨勢是超過50%的受訪者認為與新市場參與者的競爭多來自國內市場,而持這種看法的人在最近一些調查中逐步增多。對于并購活動的預測與之前的調查一致,41%的受訪者認為2016年上半年并購活動會增加,56%的受訪者認為不會改變。
At the time of writing this report, towards the close of the first half of the year, the positive expectations had looked to be well founded. Meanwhile, there has been some encouraging economic data for GDP in the EU which shows growth has been near to 2% over the four quarters to Q1 2016 – not great, but showing steady improvement over the last four to five years. Unemployment across the EU has been gradually falling since it peaked in Q2 2013, and over the same period the trend in the number of employed persons has been upward.
這篇報告完成之時正好臨近上半年結束,積極的預期得到印證。同時,歐盟GDP數據讓人振奮,到2016年第一季度為止,四個季度的GDP增長近2%,雖然不高,但能保持4/5年的穩步增長。歐盟失業率在2013年第二季度問頂后逐漸下降,同時,就業人數有所上升。
However, the impact of the shock result of the referendum in the UK on 23 June to leave the EU will be far-reaching across financial markets.
然而,6月23日英國脫歐的公投結果的沖擊,將對歐盟金融市場產生深遠影響。
資料來源:懷特克拉克集團
翻譯:中國租賃聯盟、天津濱海融資租賃研究院 張 媛
編審:中國租賃聯盟、天津濱海融資租賃研究院 季健霞
| 培訓公告 | ||
| 8月26-27日 | 上海—金水灣大酒店 | 汽車融資租賃業務操作流程、模式創新與風險控制專題研討會 |
| 歡迎垂詢 133-3106-9587 楊志軍 | ||
| 或登陸http://www.tl17.net了解課程詳情。 | ||
上一篇:租賃資產證券化融資政策與趨勢
下一篇:租賃物的選擇權與所屬權
實務操作
- 租賃物未交付,融資租賃合同是否存在被判定為“借貸”的風險?
- 人力物力都投了,經營性租賃怎么還是不賺錢?
- 城投催收這一年:“感覺有點自取其辱!”
- 行業熱議:ESG與融資租賃行業的結構轉型
- 資產質量惡化!如何拯救產業租賃的不良率?
- 非設備類售后回租被禁!再談知識產權融資租賃到底要做什么?
- 屬地化管理,是怎么難倒傳統產業租賃好漢們
- 限制異地展業后。然后呢? 轉型真租賃?
- 中小微,涉暴力催收?
- 永贏VS仲利,中小微雙雄的共同點是……

政策法規
- 國務院15號文!支持金租商租開展小微業務,完善監管規制
- 首部融資租賃地方法規落地上海!10月1日起正式實施!
- 149號文:金融租賃公司嚴禁開展非設備類售后回租
- 政策解讀 | 《上海市促進浦東新區融資租賃發展若干規定(草案)》的承繼與創新
- 南通國資委:禁止國有企業支付各類居間費用
- 《上海市促進浦東新區融資租賃發展若干規定(草案)》征求民意
- 天津金融局:給政府融資平臺融資扣分,租賃物不合規不高于D級
- 99%租賃公司將受影響?即將出臺!《地方金融監督管理條例》--央行起草
- 《北京市融資租賃公司監督管理辦法》重磅印發
- 金租服務收費再迎監管!中國銀協重磅倡議
